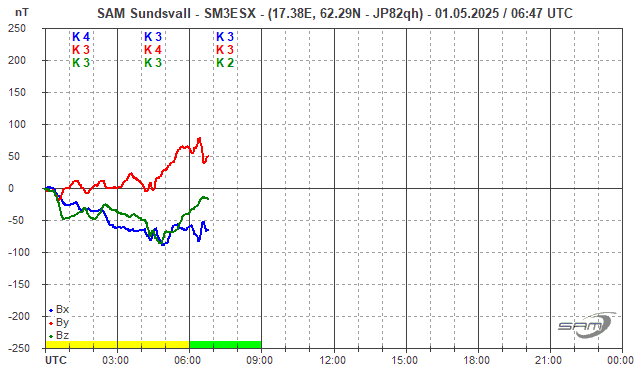
Hier sind die Diagramme aller SAM's die bis jetzt online sind. Unter dem Bild ist jeweils der Link zur SAM-Seite des jeweiligen Betreibers angegeben, woher das Diagramm stammt.
Aber bitte bedenken: Diese Daten sind alle experimentell, und haben oft umweltbedingte Störungen. Es wird aber an Filtern gearbeitet, die diese Störungen minimieren sollen.
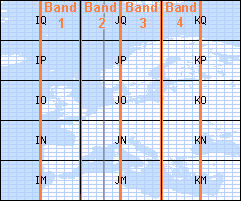
Die Diagramme sind nach dem Maidenhead-Locator-Netz geordnet, und in mehrere Nord-Süd Bänder aufgeteilt. Dies einer geografische Gliederung.
Die Bänder sind in der nebenstehenden Grafik dargestellt. Band 2 wurde nochmals wegen der großen Zahl der SAM's gesplittet.
Alternative SAM-Online Seite, Auswahl-Buttons, und Auswertung mit dem Maus-Cursor für Kurven-Werte.
Zur Hauptseite
Here are all Diagrams of the SAM's that are currently online. Below the pictures you find the links to the Users Sam-Pages, from where the magnetograms were taken.
Keep in mind that this project is stil under development and that the magnetograms are not reliable yet. The finetuning does take time and magnetic conditions have to be right to devellop filters to clean the pictures.
The arrangement is based on the Maidenhead-Locator-Grid, and divided by 4 columns in North-South direction. this results in better geografic arrangement.
The bands are displayed on the map to the left. Band 2 had been splittet, due to the great number of SAM's.
Alternative SAM-Online Page, with buttons for selection of a diagram. On that page you can read out values of the graph by mouse-cursor.
To Mainpage

(Interaktive Karte / Interactive Map)


